When you’re a sales manager, you need to keep your finger on the pulse with consistent updates on your team’s performance. It could feel like you’re selling well, but unless you use regularly updated key performance indicators, you won’t know for sure.
Related: What is sales enablement?
If you’re looking for a refresher – or even an introduction – for the kinds of KPIs you should be watching as a sales leader, we’ve got four critical KPIs for you to start with. But first, as always… the basics.
What are KPIs?
Key performance indicators, or KPIs, are vital statistics your team can use to help it sell better. Not only do they show you how many sales you’ve made over the last week, but you can also leverage them to chart your performance over time. A KPI can help you measure what you’re doing right (or wrong) and provide important evidence that your strategies are working.
KPIs also help you become a better sales manager. Instead of blindly tinkering with your sales processes, KPIs offer data-driven insights as to whether or not your adjustments really are beneficial to your team and your company’s business goals.
In other words, KPIs play an essential role in supervising & developing a high-functioning sales team.
If you’ve never come across KPIs before or haven’t used them diligently in the past, what we’re talking about could seem a little abstract. To help you better understand KPIs and what goes into creating them, we’ve identified four key measurements you should be tracking. Take them for a test drive, and you’ll soon see how helpful these metrics are for improving the effectiveness of your sales team.
How to create KPIs for sales
KPI #1 — Sales cycle length
The sales cycle length is the time between your first touchpoint with a customer and when you close the deal. It could be seconds, or it could be years — it all depends on the type of business you’re managing.
Let me reiterate that: Not all businesses operate with the same sales cycle length.
For example, a local convenience store has a sales cycle length of about two minutes. A customer walks through the door, picks up a pint of milk, goes to pay for it at the checkout, and the sale is complete.
The same is not true of an enterprise software solutions provider. It could be months (or even years) between a business customer becoming aware that the product exists and actually buying it.
As a sales manager, you’ll want to track your company’s sales cycle length. It helps you forecast how many sales you’ll make in the future. Keep in mind, if you have a long sales cycle, you can use sales cycle length to estimate the number of conversions you’ll receive over the next quarter based on your current list of prospects.
Unsure how to calculate your average sales cycle? No stress — we’ve got you covered.
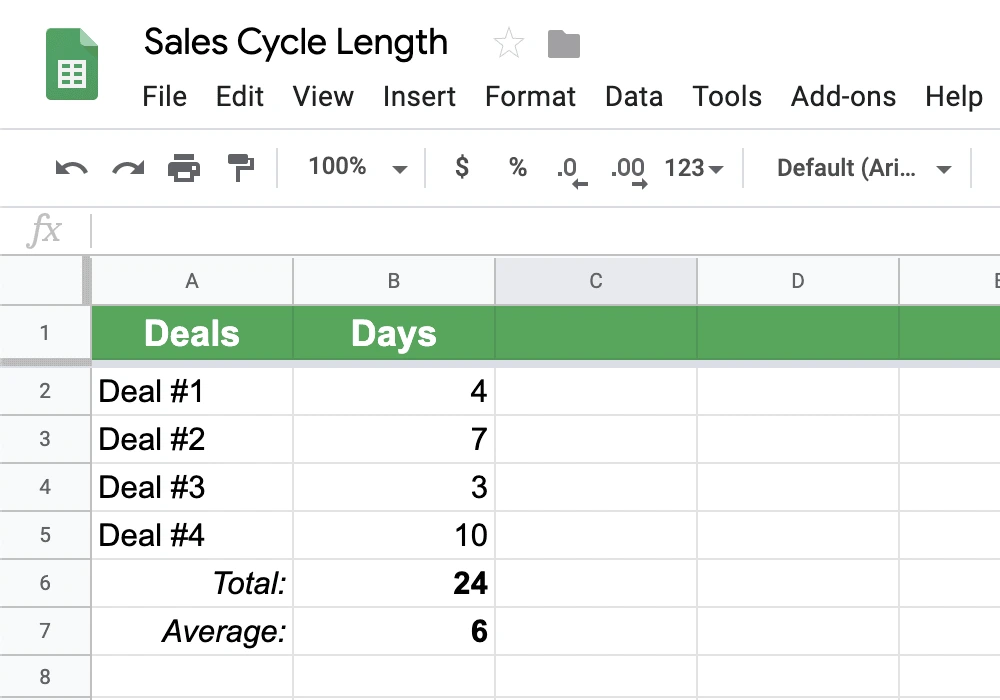
- Gather up your numbers from the past sales cycle. For example, you can track how long it took to close deals last quarter in a spreadsheet: Deal #1 took 4 days, Deal #2 took 7 days, and so on.

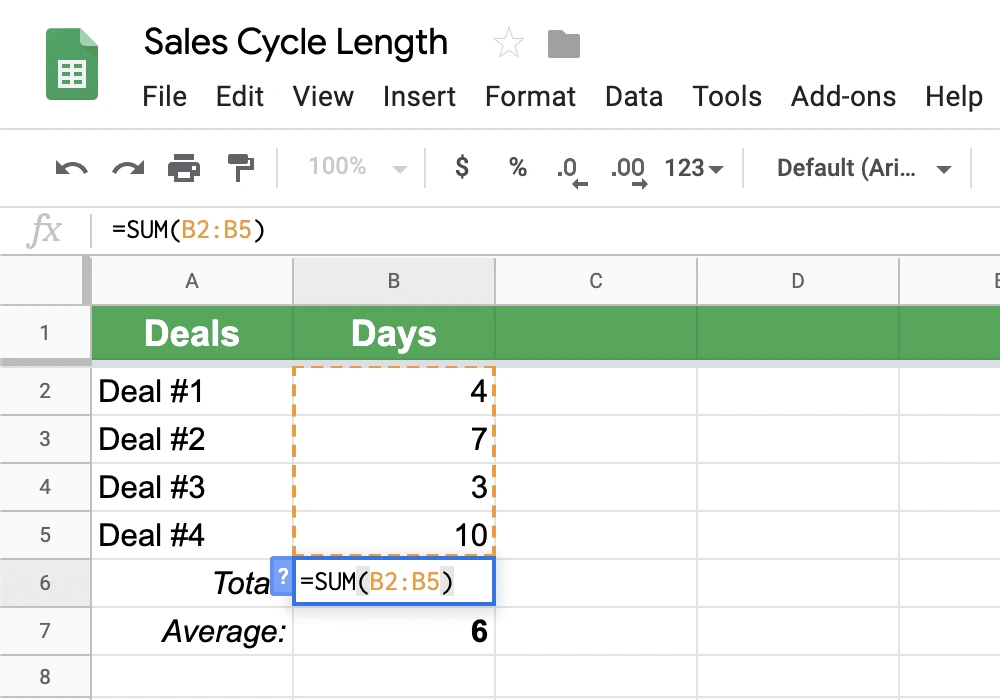
- Add up how many days it took to close each deal to get the total number of days it took to close all deals. This is easier than it sounds – it’s just a sum. For example, Deal #1 + Deal #2 + [etc.] = 24 days.

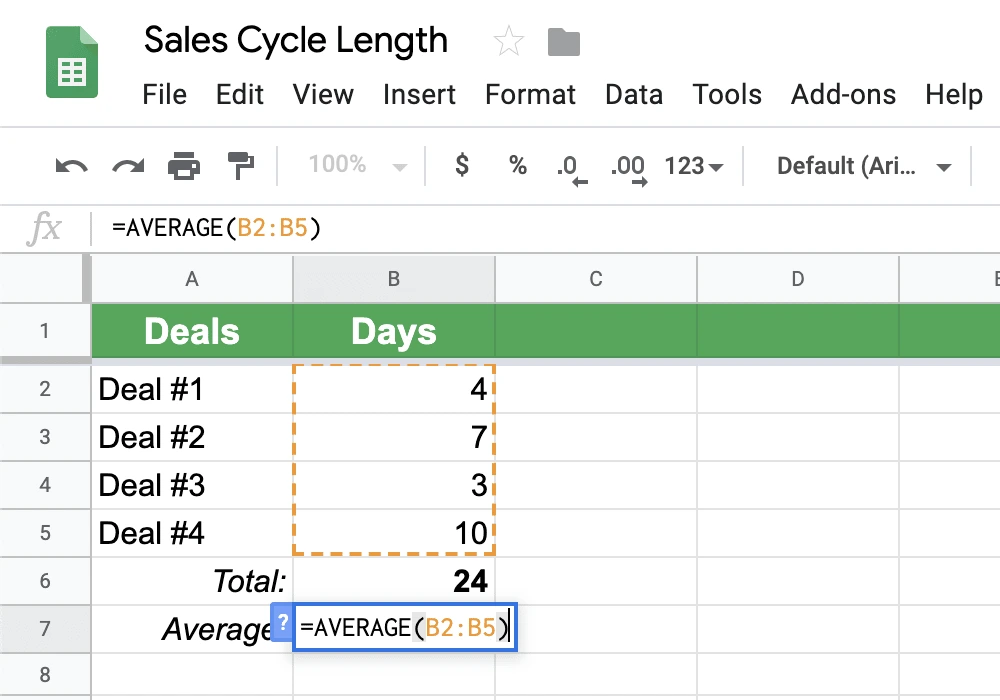
- Divide the total number of days by the total number of deals to get the average sales cycle length. Here’s the last step, where we take that sum and calculate the average. If it took 24 days to close 4 deals, that gives you an average sales cycle of 6 days.

KPI #2 — Revenue
Revenue is the total monetary value of all the sales your team makes in a given time period. To calculate revenue, you multiply quantity & price together.
Quantity x Price = Revenue
For example, if you sell double-pane windows at $200 per unit and sold 13 units in the month of April, then your total revenue for double-pane windows in April is $2,600.
Tracking revenue is significant because it showcases & elevates the true value of the sales your team is making on a monthly, quarterly or yearly basis. Plus, it helps identify which customers are most valuable to your bottom line, which in turn helps your sales team attract & convert better customers effectively & efficiently.
KPI #3 — Customer NPS
Customer net promoter score or NPS helps you uncover whether customers would recommend your services to a friend (or another business). With the help of an NPS survey, you can see how satisfied customers are with their overall experience and the products/services you provide.
While it’s true you don’t have total control over everything related to customer experience, you are on the hook for ensuring that your products/ services match a customer’s needs & expectations. That’s where NPS surveys come into play — they provide insight and help you understand whether your sales team is catering to your customers up-front and giving them the experience they deserve.
If you’d like to try your hand at sending out an NPS survey, look no further; here’s how it’s done.
- Ask your customers, on a scale of 0 to 10, how likely they are to recommend you to a friend.
- Once you’ve aggregated survey information, lump the customer ratings into the following categories:
- 0-6 are detractors
- 7-8 are passives
- 9-10 are promoters
- Add up the total responses.
- Next, calculate the percentage of responses from each category:
- Number of detractor responses / Total customer responses = Negative ratio
- Number of passive responses / Total customer responses = Ambivalent ratio
- Number of promoter responses / Total customer responses = Positive ratio
- Lastly, subtract detractors from promoters to get your customer NPS. For instance, if you have 30% promoters and 25% detractors, you have a customer NPS of 5.
KPI #4 — MQL to SQL Ratio
An MQL to SQL ratio is a vital tool to measure sales effectiveness, but to use it, you have to understand a couple of acronyms.
A marketing qualified lead (or MQL) is a prospective customer who has shown interest in buying a service or product. An MQL is a curious shopper who hasn’t committed one way or another. Alternatively, a sales qualified lead (or SQL) has confirmed that they want to purchase a product or service.
The key difference between MQLs and SQLs lies within their likelihood of purchase.
For example, say you’re observing customers as they shop in a clothing store. When a store associate approaches an MQL and asks, “Hi, is there anything I can help you find today?” the MQL will likely say, “No, I’m just browsing, thanks!” On the other hand, when an associate approaches an SQL and asks the same question, the SQL would respond with something affirmative, like “Yes! I want to try on a pair of black Dansko clogs in size 7.5.”
Establishing an MQL to SQL ratio gives you a better, more accurate sense of the effectiveness of your overall sales funnel. Ultimately, it tells you how many MQLs travel down the funnel. Not only that, it gives you an insight into how efficiently your sales funnel moves customers from one stage to the next and illustrates the quality of your leads, as well as how many are likely to convert in the future.
Key takeaways
Data tells all. While you likely have a long list of goals you want to accomplish, you still need to make time for due diligence and seek out relevant data to help you close leads, make changes, and do more as a sales team.
KPIs provide detailed insight into sales performance metrics and crucial information about your customers that no single phone call, email or text message can offer. KPIs speak volumes about the effectiveness of your sales funnel, inbound tactics, and conversations with prospects. You learn what to do (and what not to do) without ruffling too many feathers or negatively impacting your revenue.


